Trail Monitoring Program
Since 2017, Tri-State Trails has monitored trail usage in the Tri-State to show just how important multi-use trails and bikeways are to our communities.

About the Trail Monitoring Program
Trail managers and advocates in the tri-state have worked for decades to plan and build a network of multi-use trails that meets the needs of residents for recreation, transportation, and other purposes. In 2016, Tri-State Trails partnered with Interact for Health to organize Greater Cincinnati’s first comprehensive Trail Monitoring Program. This program builds on and integrates data from established monitoring programs by the Friends of Little Miami State Park, Great Parks of Hamilton County, and OKI Regional Council of Governments. By both convening other organizations' data and expanding data collection, Tri-State Trails has been able to make extremely accurate estimations of trail use patterns as well as plan for new trail and bikeway connections.
In 2017, Tri-State Trails deployed trail counters and implemented a statistically valid user intercept survey for the first time. Our Trails Count report describes the trail monitoring initiative, summarizes results, and presents recommendations for ongoing monitoring. This study was made possible by the generous support of Interact for Health.
Trail usage data collection has expanded and is ongoing. In 2024, Tri-State Trails entered its eighth year of trail monitoring. Learn more by reading below, and get access to the full dataset we've collected by becoming a member of Tri-State Trails today.
Trail Traffic Count Technology
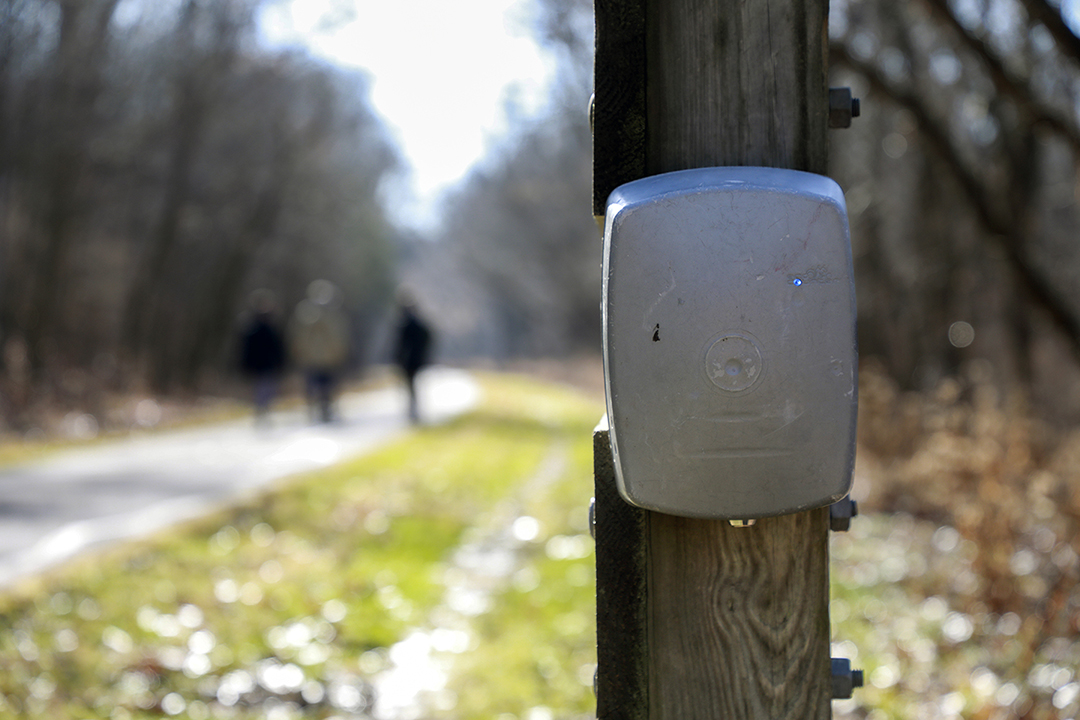
Tri-State Trails collects trail traffic data by deploying counters that use remote sensor technology. Aside from our five permanent counters placed throughout the region, a series of short-term counters are rotated through the region’s trail network on a weekly basis through the spring, summer, and fall. Using negative bi-nominal regression modeling, the trail usage data collected is analyzed to generate metrics like Average Annual Daily Trail Traffic (AADTT) and Trail Miles Traveled (TMT).
The counters are engineered by Eco-Counter, a global provider of turn-key solutions for cyclist and pedestrian counting and data analysis. The counters that we deploy use passive infrared pyroelectric technology to count the number of people on trails and record which direction they came. The counters are not cameras.
Our trail data is used as a guide to assist our trail planning processes and our partners’ efforts to expand and connect trails and bikeways in our region’s network.

Want your trail counted? Become a member today.
At the Trailblazer level, members get access to trail monitoring services. Staff will work with your community to collect a 7-day snapshot of trail usage on your regional trail at up to 4 locations. After the calendar year is complete, Trailblazer Members receive the raw data, inclusion in our comprehensive regional trail usage analysis and a customized report. Learn more about our membership program here.
Quick Facts from 2024
17.2 million
Trail Miles Traveled
267 Trail Users a day
Average Annual Daily Trail Traffic
190+ Miles
Monitored
ohio river trail
Trail usage on this corridor increased by 5% in 2024. At Cincinnati's Riverfront Parks, daily usage saw a staggering 50% increase from 2023.
CROWN
Daily usage on the CROWN loop trails is up 20% from 2023. The CROWN trails have a daily usage almost twice that of the regional average, with nearly 500 users a day.
Dearborn trail
In 2024, the Dearborn Trail in Aurora saw a 12% increase. Unlike other trails in our network, Aurora's trail usage has been increasing steadily every year since 2020.


Stay in the Loop
Be sure you hear about this year's trail monitoring findings and sign up for Tri-State Trail's Tribune. You may also sign up to hear about volunteer opportunities which may include surveying trail users.
Annual Findings
Tri-State Trails’ 2024 Trail Monitoring Report
March 17, 2025 by Rachel Culley
Tri-State Trails Releases Initial Insights from 2023 Trail Monitoring Data
April 1, 2024 by Pat LaFleur
Trail usage increased in 2022
February 2, 2023 by Rachel Culley
ICYMI: Tri-State Trails and partners showcase new trail progress across the region
February 3, 2021 by Wade Johnston